GDP, or Gross Domestic Product, is the total monetary value of all finished goods and services produced within a country’s borders during a specific period — usually a quarter or a financial year. It is the single most-watched number in economics because it measures the size of an economy and how fast it is growing. In India, GDP is compiled and released by the National Statistics Office (NSO) under the Ministry of Statistics and Programme Implementation (MoSPI), and it shapes everything from RBI interest-rate decisions to the Union Budget.
What GDP means (full form & definition) ·
The 3 ways GDP is calculated ·
Nominal vs real GDP ·
GDP vs GNP, GVA & NDP ·
GDP per capita & PPP ·
How India measures its GDP (MoSPI) ·
Why GDP matters ·
Limitations of GDP ·
FAQs
What Is GDP? Full Form and Definition
The full form of GDP is Gross Domestic Product. Breaking the phrase apart explains the concept neatly:
- Gross — it counts total output without subtracting the wear-and-tear (depreciation) on machines, buildings and infrastructure used to produce it.
- Domestic — it counts production inside a country’s geographic borders, no matter whether the producer is Indian or foreign. A Korean carmaker’s factory in Tamil Nadu adds to India’s GDP; an Indian engineer working in Dubai does not.
- Product — it measures finished goods and services, valued at their market prices.
So, in plain language, GDP is the rupee value of everything an economy produces in a year. Economists treat it as the broadest single scorecard of economic activity. When you read that India is the world’s fourth or fifth largest economy, that ranking is based on the size of its GDP measured in US dollars.
Why only “final” goods are counted
Imagine the journey of a loaf of bread. A farmer grows wheat and sells it to a miller; the miller turns it into flour and sells it to a baker; the baker bakes bread and sells it to you. If we added up every transaction in this chain, we would count the value of the wheat three or four times over. To avoid this double-counting, GDP counts only the value of the final good (the bread) — or, equivalently, the value added at each stage. This “value added” approach is the foundation of how India actually compiles its numbers, as we will see.
How GDP Is Calculated: The Three Methods
There is no single meter that reads off a country’s GDP. Statisticians estimate it using three different approaches that, in theory, should all arrive at the same total because one person’s spending is another person’s income, which in turn reflects production.
1. The production (output / value-added) method
This approach adds up the value added by every producing unit in the economy — farms, factories, banks, shops, IT firms, government offices. Value added is the value of what a business produces minus the cost of inputs it bought from others. Summing value added across agriculture, industry and services (and adjusting for taxes and subsidies on products) gives GDP. This is the method most closely tied to Gross Value Added (GVA), which India publishes alongside GDP.
2. The income method
Everything that is produced generates income for someone. The income method totals all the incomes earned by factors of production within the country: compensation of employees (wages and salaries), operating surplus (business profits and rents), mixed income of the self-employed, plus taxes minus subsidies on production. Add it all up and you again arrive at GDP.
3. The expenditure method
This is the formula students memorise. It adds up everything spent on final goods and services in the economy:
C = Private consumption (households buying food, fuel, phones, services)
I = Investment (businesses buying machinery, building factories, plus housing)
G = Government spending (salaries, infrastructure, defence)
X − M = Net exports (exports minus imports)
In India, private consumption (C) is by far the biggest engine, typically making up roughly 55–60% of GDP, which is why festive-season demand and rural spending get so much attention. The four components are shown below.
| Method | What it adds up | Key India link |
|---|---|---|
| Production / Output | Value added by every sector (farms, factories, services) | Basis of Gross Value Added (GVA) |
| Income | Wages + profits + rent + interest + mixed income | Used to cross-check estimates |
| Expenditure | C + I + G + (X − M) | Headline GDP is reported this way |
Nominal GDP vs Real GDP
This distinction trips up many people, so it is worth getting right. The difference is simply whether you have removed the effect of rising prices (inflation).
What is nominal GDP?
Nominal GDP measures output at current market prices — the prices that actually prevailed during the year being measured. Because it is not adjusted for inflation, nominal GDP can rise even if the economy produced exactly the same quantity of goods, simply because prices went up.
What is real GDP?
Real GDP measures output at constant prices — the prices of a fixed “base year.” By holding prices constant, real GDP strips out inflation and shows the genuine change in the volume of goods and services. When economists and the media quote India’s “GDP growth rate,” they almost always mean real GDP growth, because that is what tells you whether the economy is truly expanding.
The ratio between the two gives the GDP deflator, a broad measure of inflation across the whole economy:
| Feature | Nominal GDP | Real GDP |
|---|---|---|
| Prices used | Current-year prices | Base-year (constant) prices |
| Adjusted for inflation? | No | Yes |
| Best for | Size of economy today; debt & tax ratios | Comparing growth across years |
| Can it rise on price hikes alone? | Yes | No |
| Used for “GDP growth rate”? | Rarely | Almost always |
GDP vs GNP, GVA and NDP
GDP has several close cousins. Knowing how they differ helps you read economic news accurately.
GDP vs GNP (Gross National Product)
The key difference is borders versus citizens. GDP counts output produced within a country regardless of who produces it. GNP (also called Gross National Income, GNI) counts output produced by a country’s residents and companies, wherever in the world they are, and excludes income earned domestically by foreigners.
GVA, NDP and NNP
- GVA (Gross Value Added) = GDP minus net taxes on products. India’s NSO releases GVA first, then adds net product taxes to arrive at GDP. GVA is often seen as a cleaner read on producer-side activity.
- NDP (Net Domestic Product) = GDP minus depreciation (the “consumption of fixed capital”). It reflects output after accounting for wear-and-tear on assets.
- NNP (Net National Product) = GNP minus depreciation. NNP at factor cost is what is commonly called National Income.
| Measure | Formula (simplified) | Counts whom? |
|---|---|---|
| GDP | Value of final output inside borders | Everyone inside India |
| GNP / GNI | GDP + net income from abroad | Indian residents worldwide |
| GVA | GDP − net taxes on products | Producers (supply side) |
| NDP | GDP − depreciation | Inside India, net of wear-and-tear |
| NNP (National Income) | GNP − depreciation | Residents, net of wear-and-tear |
GDP Per Capita and the PPP Adjustment
What is GDP per capita?
GDP per capita is simply GDP divided by the total population. It estimates the average economic output (and, loosely, the average income) per person, and is a far better gauge of living standards than total GDP. This is why India can be one of the world’s largest economies by total GDP while still ranking much lower on a per-capita basis — the output is shared among more than 1.4 billion people.
What is PPP (Purchasing Power Parity)?
Comparing GDP across countries using market exchange rates can be misleading because a rupee buys more in India than a dollar’s worth buys in the United States. Purchasing Power Parity (PPP) adjusts for these price differences so that a given amount of money represents the same basket of goods everywhere. On a GDP-PPP basis, India ranks among the top three economies in the world — higher than its rank on a market-exchange-rate basis — because everyday goods and services are cheaper here.
How India Calculates Its GDP (MoSPI & the NSO)
In India, official GDP estimates are produced by the National Statistics Office (NSO), which sits within the Ministry of Statistics and Programme Implementation (MoSPI). (The NSO was formed by merging the Central Statistics Office and the National Sample Survey Office.) The numbers are built up sector by sector using the value-added approach, then released on a fixed calendar.
The release calendar
India’s financial year runs from 1 April to 31 March. GDP is published every quarter and then for the full year, with several rounds of revision as more complete data flows in:
- Quarterly estimates — released roughly two months after each quarter ends (Q1: Apr–Jun, Q2: Jul–Sep, Q3: Oct–Dec, Q4: Jan–Mar).
- First Advance Estimates — an early projection of the full year, released in early January, used as a key input for the Union Budget.
- Provisional & Revised Estimates — firmer figures released later as actual data replaces projections.
Base year and data sources
To compute real GDP, the NSO fixes a base year whose prices are held constant; the base year is periodically updated so the data reflects the modern structure of the economy. (India has used a 2011–12 base year and has been working to move to a more recent base.) The estimates draw on a wide range of sources — the Index of Industrial Production (IIP), corporate financial results filed with the Ministry of Corporate Affairs, agricultural output data, GST collections, banking and railway data, and large household and enterprise surveys. India compiles its accounts following the United Nations’ System of National Accounts (SNA), the global standard, which makes cross-country comparison possible.
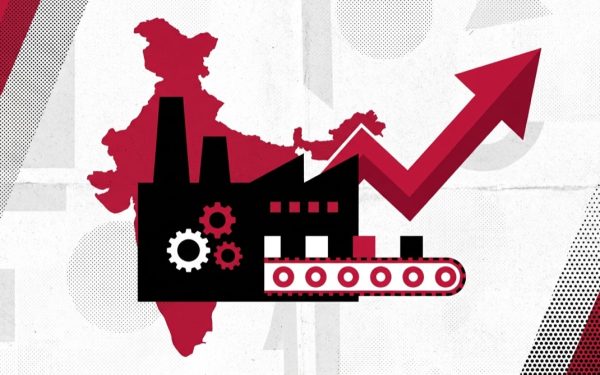
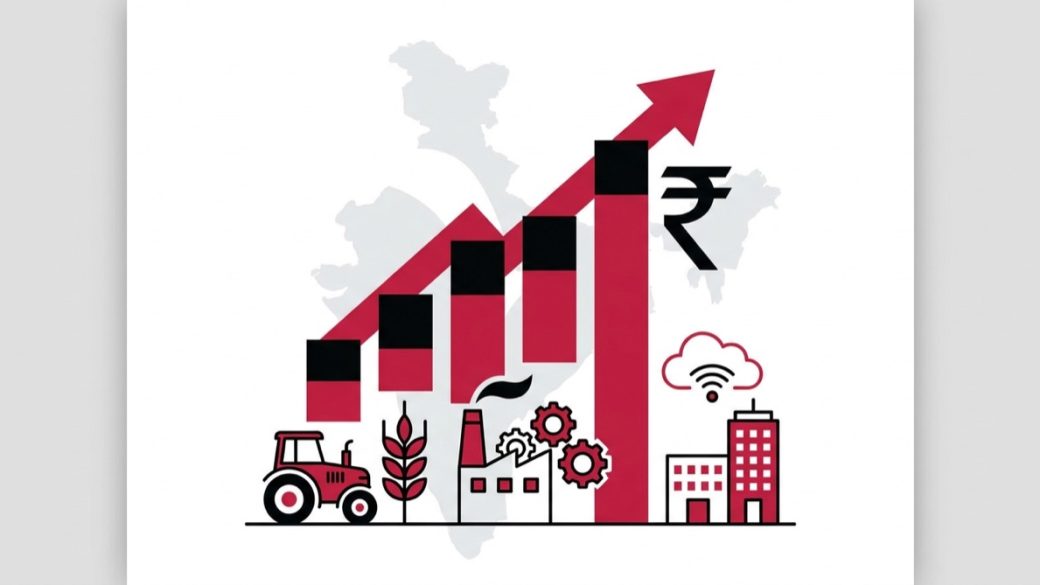
The three sectors of India’s GDP
On the production side, output is grouped into three broad sectors. Services are the largest contributor to India’s economy.
| Sector | Includes | Rough share of GVA |
|---|---|---|
| Services (Tertiary) | IT, finance, trade, transport, telecom, real estate, public administration | Largest — over half |
| Industry (Secondary) | Manufacturing, mining, electricity, construction | Roughly a quarter to a third |
| Agriculture (Primary) | Crops, livestock, forestry, fishing | Smallest by value, but employs the most people |
Why GDP Matters
GDP is not an academic abstraction — it drives real decisions that affect jobs, prices and policy.
- Policy & interest rates: The RBI weighs GDP growth against inflation when setting the repo rate. The government uses GDP projections to frame the Union Budget and set borrowing targets.
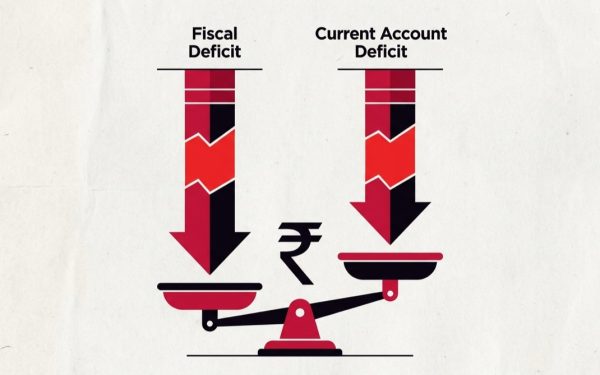
- Fiscal ratios: Key health metrics — the fiscal deficit, public debt and tax collections — are all expressed as a percentage of GDP. A growing GDP makes a given level of debt more manageable.
- Investment & markets: Domestic and foreign investors track GDP growth to judge demand and corporate-earnings potential. Faster growth can attract capital.
- Global standing: A country’s GDP ranking shapes its weight in bodies like the G20, IMF and World Bank, and its bargaining power in trade talks.
- Jobs & incomes: Sustained GDP growth is generally needed (though not always sufficient) to create jobs and lift incomes for a young, growing workforce.
The Limitations of GDP
For all its usefulness, GDP is an imperfect measure of national well-being. Economists have criticised it for decades, and it is important to know what it leaves out.
- It ignores distribution. GDP can rise while inequality widens; the average says nothing about how output is shared.
- It misses unpaid and informal work. Household labour, caregiving and much of the vast informal economy are hard to capture — a particular challenge in India, where a large share of activity is informal.
- It says nothing about quality of life. Health, education, leisure, safety and happiness are not in the number.
- It ignores environmental cost. Pollution and the depletion of natural resources can actually raise GDP (more output, plus spending to clean up), even as they reduce real welfare.
- “Bads” can boost it. Rebuilding after a disaster or rising medical bills add to GDP without making people better off.
This is why analysts pair GDP with other indicators — the Human Development Index (HDI), per-capita income, unemployment, inflation and inequality measures — to form a fuller picture. GDP tells you how big the pie is, not how it is sliced or whether baking it harmed the kitchen.
Frequently Asked Questions About GDP
What is the full form of GDP?
GDP stands for Gross Domestic Product. It is the total market value of all final goods and services produced within a country’s borders during a given period, usually a quarter or a financial year.
What is meant by GDP in simple words?
In simple terms, GDP is the rupee value of everything an economy produces in a year. It is the most common way to measure the size of an economy and how fast it is growing.
How is GDP calculated in India?
India’s National Statistics Office (NSO), under MoSPI, calculates GDP mainly using the value-added (production) method across agriculture, industry and services, and reports headline GDP on the expenditure side as C + I + G + (X − M). It draws on data such as the IIP, corporate results, GST collections and large surveys, and releases quarterly and annual estimates that are revised over time.
What is the difference between nominal GDP and real GDP?
Nominal GDP is measured at current prices and is not adjusted for inflation, so it can rise simply because prices went up. Real GDP is measured at constant base-year prices, removing inflation, so it reflects the true change in the volume of output. The “GDP growth rate” you see in the news is almost always real GDP growth.
What is the difference between GDP and GNP?
GDP counts output produced inside a country’s borders, regardless of who produces it. GNP (Gross National Product) counts output produced by a country’s residents and companies anywhere in the world. GNP = GDP + income earned by residents abroad − income earned by foreigners domestically.
What is GDP per capita?
GDP per capita is GDP divided by the total population. It approximates the average economic output or income per person and is a better measure of living standards than total GDP. India ranks high on total GDP but much lower on GDP per capita because of its large population.
What is GDP and PPP?
PPP stands for Purchasing Power Parity. GDP measured at PPP adjusts for price-level differences between countries, so the same amount of money buys the same basket of goods everywhere. On a PPP basis India is among the top three economies in the world, higher than its rank using market exchange rates, because goods and services are cheaper in India.
Disclaimer: This article is for educational purposes only and is not investment/financial advice. Read all scheme/offer documents and consult a SEBI-registered adviser where relevant.