Fundamental analysis decides what stock to buy by studying a company’s business, financial statements and valuation; technical analysis decides when to buy or sell by reading price charts, volume and indicators. Long-term investors lean on fundamentals, active traders lean on technicals, and many serious market participants in India blend the two — using fundamentals to pick quality businesses and technicals to time their entry.
What the two approaches actually mean
Every method of analysing a stock is, at heart, an attempt to answer one of two questions: “Is this a good business at a fair price?” or “Which way is the price likely to move next?” Fundamental analysis answers the first; technical analysis answers the second.
Fundamental analysis studies the company behind the ticker. You read its profit-and-loss statement, balance sheet and cash-flow statement, calculate ratios, judge the quality of management and the durability of its competitive advantage, and then form a view of what the business is genuinely worth. If the market price is well below that worth, the stock looks attractive. This is the school associated with Benjamin Graham and Warren Buffett, and in India with long-term portfolio investors.
Technical analysis mostly ignores the business and studies the price itself. The core belief is that all known information — earnings, news, sentiment — is already reflected in the price, and that price moves in identifiable trends and repeating patterns driven by the psychology of buyers and sellers. A technical analyst reads candlestick charts, trendlines, support and resistance levels, volume and a handful of indicators to estimate probable direction and to set entry, target and stop-loss levels.
Fundamental analysis: financials, ratios & the moat
Fundamental analysis works from the assumption that a share is a fractional ownership stake in a real business. Over the long run, the price tends to follow the company’s earnings and cash flows. So the analyst’s job is to estimate the underlying value (often called “intrinsic value”) and compare it to the market price.
The three financial statements
Every fundamental study starts with the company’s filings — for Indian listed companies these are published on the BSE and NSE websites and in the annual report:
- Profit & Loss (income statement): revenue, expenses and net profit over a period. Tells you whether the business makes money and whether sales and profit are growing.
- Balance Sheet: a snapshot of assets, liabilities and shareholders’ equity. Tells you how much debt the company carries and how strong its financial position is.
- Cash-Flow Statement: actual cash moving in and out from operations, investing and financing. Profit can be massaged by accounting choices; cash is harder to fake, so this statement is a vital reality check.
Key ratios every beginner should know
Ratios turn raw numbers into comparable signals. None should be read in isolation — always compare a company with its own history and with peers in the same sector.
| Ratio | What it measures | Quick read |
|---|---|---|
| P/E (Price to Earnings) | Price paid per rupee of annual profit | High P/E = expensive or high growth expected; compare within sector |
| P/B (Price to Book) | Price vs net asset value on the books | Useful for banks and asset-heavy firms |
| ROE (Return on Equity) | Profit generated on shareholders’ money | Consistently high ROE signals quality |
| ROCE (Return on Capital Employed) | Returns on total capital (equity + debt) | Good for comparing capital-intensive businesses |
| Debt-to-Equity | Borrowings vs own funds | Lower is safer; very high debt is a red flag |
| Dividend Yield | Annual dividend as % of price | Matters for income-focused investors |
Qualitative factors and the “moat”
Numbers tell you what happened; judgement tells you whether it will continue. Fundamental analysts also weigh qualitative factors: the integrity and track record of promoters and management, corporate-governance quality, the size of the growth opportunity, and the company’s economic moat — a durable competitive advantage that protects profits from rivals. Moats can come from a strong brand, network effects, low-cost production, switching costs, patents, or regulatory licences. In India, investors also look closely at promoter shareholding, related-party transactions and any pledging of shares.
Top-down vs bottom-up
A top-down approach starts with the big picture — the economy, interest rates, then attractive sectors, and finally individual companies. A bottom-up approach starts with the company itself and worries less about macro timing. Both are valid; many investors blend them.
Technical analysis: charts, indicators & patterns
Technical analysis rests on three classic assumptions: the price discounts everything, prices move in trends, and history tends to repeat because human psychology is consistent. Rather than asking what a company is worth, the technical analyst asks what the chart is telling them about supply, demand and momentum.
Charts, trend, support and resistance
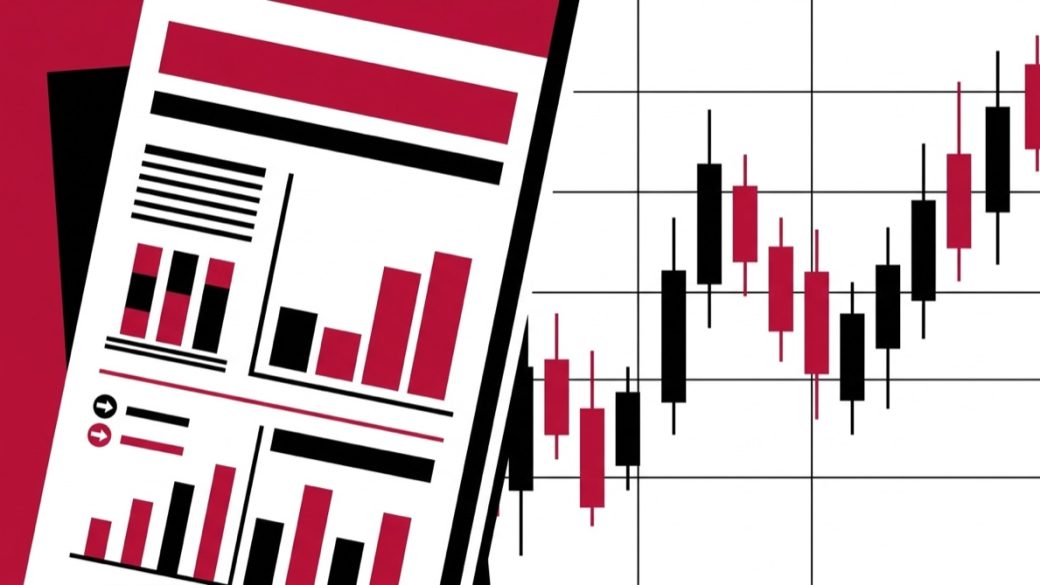
Most Indian traders use candlestick charts, where each candle shows the open, high, low and close for a period. The first thing to read is the trend — a series of higher highs and higher lows is an uptrend; lower highs and lower lows is a downtrend. Support is a price zone where buying has repeatedly emerged; resistance is a zone where selling has repeatedly appeared. Traders watch how price behaves around these zones and around volume, which shows the conviction behind a move.
Common indicators
Indicators are formulas plotted on or below the price chart to summarise momentum, trend or volatility. A few widely used ones:
| Indicator | Type | Typically used to… |
|---|---|---|
| Moving Average (SMA/EMA) | Trend | Smooth price and identify trend direction |
| RSI (Relative Strength Index) | Momentum | Spot overbought/oversold conditions (0–100 scale) |
| MACD | Trend / momentum | Signal shifts in momentum via crossovers |
| Bollinger Bands | Volatility | Gauge how stretched price is from its average |
| Volume | Confirmation | Confirm the strength of a breakout or trend |
Chart patterns
Technical analysts also look for repeating shapes that often precede certain moves — for example head-and-shoulders, double tops and bottoms, triangles, flags and breakouts above resistance. These patterns are probabilistic, not guaranteed; this is why disciplined traders always pair a pattern with a stop-loss that caps the loss if the trade goes wrong.
Fundamental vs technical: side-by-side
The two methods differ in almost every dimension — the data they use, the time horizon, and the kind of person they suit.
| Dimension | Fundamental analysis | Technical analysis |
|---|---|---|
| Core question | What is the business worth? | Which way will price move? |
| Data used | Financial statements, ratios, management, industry | Price, volume, charts, indicators |
| Time horizon | Months to years | Minutes to a few weeks |
| Best for | Investing & portfolio building | Trading & timing entries/exits |
| Main risk | Being right but waiting years; misjudging value | False signals; whipsaws; over-trading |
| Key tools | Annual reports, screeners, valuation models | Charting platforms, indicators, patterns |
| Mindset | Patience, business owner’s lens | Discipline, risk management, speed |
When to use which
Lean fundamental if…
- You are a long-term investor or building a retirement / SIP-style equity portfolio.
- You want to buy and hold quality businesses for years and can ignore short-term noise.
- You care about whether a company can compound earnings, not where the price is next week.
Lean technical if…
- You are an active trader operating over days or weeks (swing trading) or intraday.
- Your goal is to time entries and exits and to define precise stop-loss and target levels.
- You are dealing with derivatives or momentum strategies where timing dominates.
A useful rule of thumb: the longer your holding period, the more fundamentals matter; the shorter it is, the more technicals matter. An investor planning to hold for a decade barely needs a chart, while an intraday trader has no time for a five-year valuation model.
How to combine both (techno-funda)
Many experienced Indian market participants do not treat this as an either/or choice. The blended approach — sometimes called “techno-funda” — uses fundamental analysis to decide what to own and technical analysis to decide when to act.
A typical workflow looks like this:
- Shortlist with fundamentals. Use a screener to find financially sound companies — consistent profit growth, healthy ROE/ROCE, manageable debt, trustworthy management.
- Confirm the story. Read the annual report and recent results to make sure the numbers reflect a real, durable business with a moat.
- Time the entry with technicals. Wait for a favourable chart setup — price near support, a confirmed uptrend, or a clean breakout on rising volume — instead of buying at random.
- Manage risk. Decide position size in advance and, for shorter-term positions, set a stop-loss. Review the fundamental thesis periodically; exit if it breaks.
Tools & data sources in India
You do not need expensive software to begin. The essentials are widely available, many of them free.
| Need | Where to look (India) |
|---|---|
| Official filings & results | Company investor-relations page; BSE and NSE websites; annual reports |
| Ratios & fundamental screening | Stock screener and financial-data websites that compile filings |
| Price charts & indicators | Charting platforms; charts built into your broker’s trading app |
| Corporate actions & disclosures | BSE/NSE announcements; SEBI website for regulations |
| Account to actually invest | A SEBI-registered broker; a Demat + trading account |
Beginner pitfalls to avoid
Common fundamental mistakes
- Judging a stock by one ratio. A low P/E can signal value — or a business in trouble. Always look at the full picture and compare with peers.
- Ignoring debt and cash flow. A company can show “profit” while bleeding cash or drowning in borrowings. Read the cash-flow statement and balance sheet.
- Confusing a great company with a great price. Even an excellent business can be a poor investment if you overpay.
- Skipping governance. Watch promoter pledging, related-party transactions and audit red flags.
Common technical mistakes
- Trading without a stop-loss. Technical signals fail regularly; a stop-loss is what keeps a wrong call from becoming a disaster.
- Indicator overload. Stacking ten indicators creates noise and contradictions. A few well-understood tools beat a cluttered chart.
- Over-trading. Frequent trading racks up brokerage, taxes and mistakes. Wait for clean setups.
- Mistaking a pattern for a guarantee. Patterns shift probabilities; they do not remove risk. Manage position size accordingly.
Frequently asked questions
What is the difference between fundamental and technical analysis?
Fundamental analysis studies a company’s business and financials — revenue, profit, debt, ratios, management and competitive advantage — to estimate what the stock is worth and decide what to buy. Technical analysis studies the price chart, volume and indicators to estimate which way the price is likely to move and decide when to buy or sell.
Which is better for beginners, fundamental or technical analysis?
For most beginners who want to invest rather than trade, fundamental analysis is the safer starting point: it teaches you to think like a business owner and is more forgiving of short-term mistakes. Technical analysis suits those who plan to trade actively over shorter periods and are willing to be strict about stop-losses and risk.
Can I use both fundamental and technical analysis together?
Yes. The blended “techno-funda” approach is common in India: use fundamentals to shortlist financially sound companies, then use technicals to time your entry near support or on a confirmed breakout. The two methods answer different questions and complement each other well.
Is fundamental analysis useful for intraday trading?
Not very. Intraday and very short-term trading is dominated by price action, momentum and news flow, so traders rely mainly on technical analysis. Fundamentals move slowly and matter far more over months and years than within a single trading session.
What ratios should a beginner learn first for fundamental analysis?
Start with a handful: P/E and P/B for valuation, ROE and ROCE for quality of returns, and debt-to-equity for financial safety. Always compare a company against its own history and its sector peers rather than reading any single number in isolation.
Does technical analysis really work?
Technical analysis is a probabilistic framework, not a crystal ball. It can help identify trends, likely support and resistance, and sensible risk levels, but signals fail regularly. That is precisely why disciplined traders combine it with strict risk management and stop-losses rather than treating any pattern as a guarantee.
Where can I find data to analyse Indian stocks?
Company annual reports and investor-relations pages, the BSE and NSE websites for filings and announcements, the SEBI website for regulations, stock-screener and charting platforms for ratios and charts, and your SEBI-registered broker’s app for live prices. Always cross-check third-party data against official filings.
Disclaimer: This article is for educational purposes only and is not investment/financial advice. Read all scheme/offer documents and consult a SEBI-registered adviser where relevant.