📚 New to this topic? Read our full guide: Indian Economy Explained.
May IIP Jumps 5.1%: India’s Factories and Power Plants Power Up
India’s factories, mines and power plants made more in May than they did a year ago. The May IIP growth came in at 5.1%. IIP stands for Index of Industrial Production. It is a single number that tracks how much the country produces. A higher number means more was made.
This figure is “year-on-year” (YoY). That means it compares May this year with May last year. The 5.1% rise was a little better than April, which grew 4.9%. So the trend is moving up, not down.
The data comes from MoSPI. That is the Ministry of Statistics and Programme Implementation. It is the government body that counts and reports India’s official numbers. MoSPI said the IIP value was 122.7 in May. A year earlier it was 116.7. The jump from 116.7 to 122.7 is what gives us the 5.1% growth.
Which sectors grew the most?
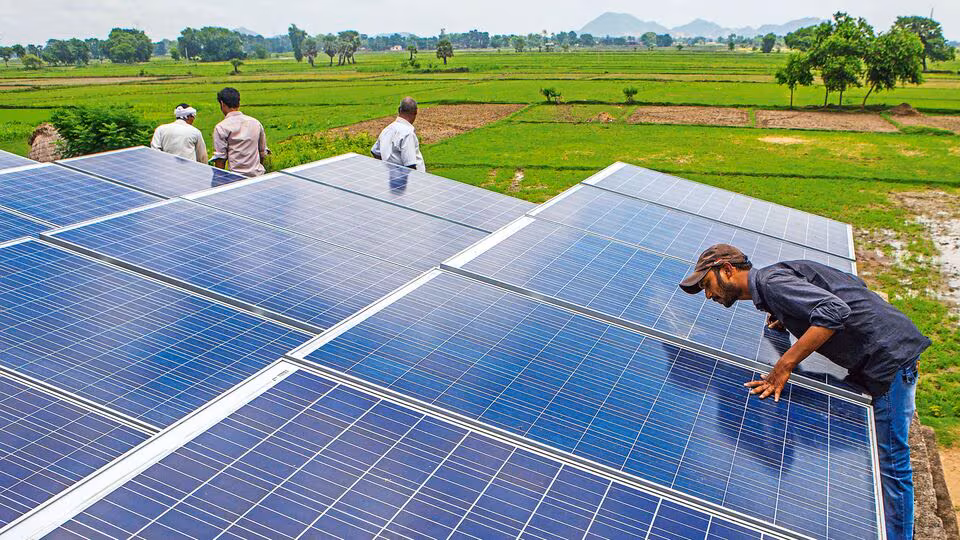
Power led the way. Electricity and gas supply rose 9.9%. That was the strongest of all the big sectors. It means homes, shops and factories used a lot more power than last year.
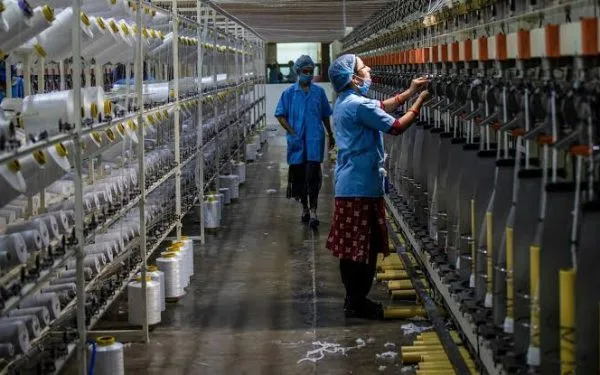
Manufacturing grew 5.5%. Manufacturing means making goods like cars, phones and machines. It carries the highest weight in the IIP. So when factories do well, the whole index does well. Water supply, sewerage and waste management also grew 5.5%.
Only one big sector fell. Mining and quarrying dropped 1.6%. Mining means digging out coal, metals and minerals from the ground. It was the lone weak spot in an otherwise strong month.
| Sector | Growth (year-on-year) |
|---|---|
| Electricity & gas supply | +9.9% |
| Manufacturing | +5.5% |
| Water supply, sewerage & waste | +5.5% |
| Mining & quarrying | -1.6% |
A closer look inside manufacturing
Manufacturing is split into 23 industry groups. In May, 16 of those 23 groups grew. That means most parts of the factory sector were healthy, not just a few.
Auto and electrical equipment were among the top performers. Auto means vehicles like cars, bikes and trucks. Electrical equipment means things like motors, wires and transformers. Strong demand for these shows that both households and businesses are spending and building.
What is the “new IIP series”?
MoSPI did not just release a number. It also released a brand-new version of the IIP series. The big change is a fresh “base year” of 2022-23. A base year is the year you compare everything against. Using a more recent base year keeps the data closer to today’s economy.
There was a second change too. MoSPI swapped the tool it uses to remove the effect of prices. Earlier it used the Wholesale Price Index, or WPI. WPI tracks the prices businesses pay each other for goods. Now MoSPI uses the Output Producer Price Index, or Output PPI. PPI tracks the prices producers receive for what they make.
Why does this swap matter? Both WPI and PPI act as a “deflator.” A deflator strips out price changes so you see the real, inflation-adjusted change in output. In simple words, it tells you if more was actually made, not just if prices went up. MoSPI says the PPI deflator gives a cleaner, truer picture.
This update is large. It affects 234 of the 463 item groups. That is 36.02% of the total index weight. The revised series replaces the older WPI-based numbers that came out on June 1. MoSPI says the new method improves real-output estimates, brings India in line with global best practice, and helps build better GDP estimates. GDP, or Gross Domestic Product, is the total value of everything a country produces.
Why it matters (especially for India and founders)
The IIP is more than a statistic. It is a quick health check for the real economy. When it rises, it usually means more orders, more jobs and more activity on the ground.
For founders and small business owners, the signals are useful. Strong power demand and rising auto output often point to confident spending. That can mean a better moment to launch, hire or stock up. This kind of demand reading matters as much for startups as it does for giants like Amazon, who study the same trends closely. You can see how big companies read India’s demand to plan their own moves.
Cleaner data also builds trust. When GDP and IIP numbers are more accurate, investors and lenders feel safer putting money to work. That sits alongside other proof points of a maturing economy, like India’s digital payments boom, which shows how fast Indian commerce is modernising.
Frequently asked questions
Q: What is the May IIP growth figure?
A: India’s industrial output grew 5.1% year-on-year in May. That was up from 4.9% in April.
Q: Which sector did best in May?
A: Electricity and gas supply, which rose 9.9%. Manufacturing followed at 5.5%.
Q: What changed in the new IIP series?
A: MoSPI moved to a 2022-23 base year. It also replaced the WPI deflator with the Output PPI deflator to better strip out price changes.
Q: Why was only mining negative?
A: Mining and quarrying fell 1.6%, the only major sector to drop. It was the lone weak spot in a strong month.
The takeaway
May was a solid month for Indian industry. Output rose 5.1%, power surged, and most factory groups grew. At the same time, MoSPI made the data sharper with a new base year and a better deflator. Together, that is good news for anyone watching India’s growth.
For the full data and sector details, see the original report on Financial Express.